

Syncs
You can set up as many syncs as you like, and if you make any changes to the content, Lightdash will update the syncs the next time they’re sent.Creating a Sync
All users with editor access or above can create Syncs. To do this, open your chart in view or edit mode, click the three-dot menu in the top-right corner, then click onGoogle Sheets Sync.
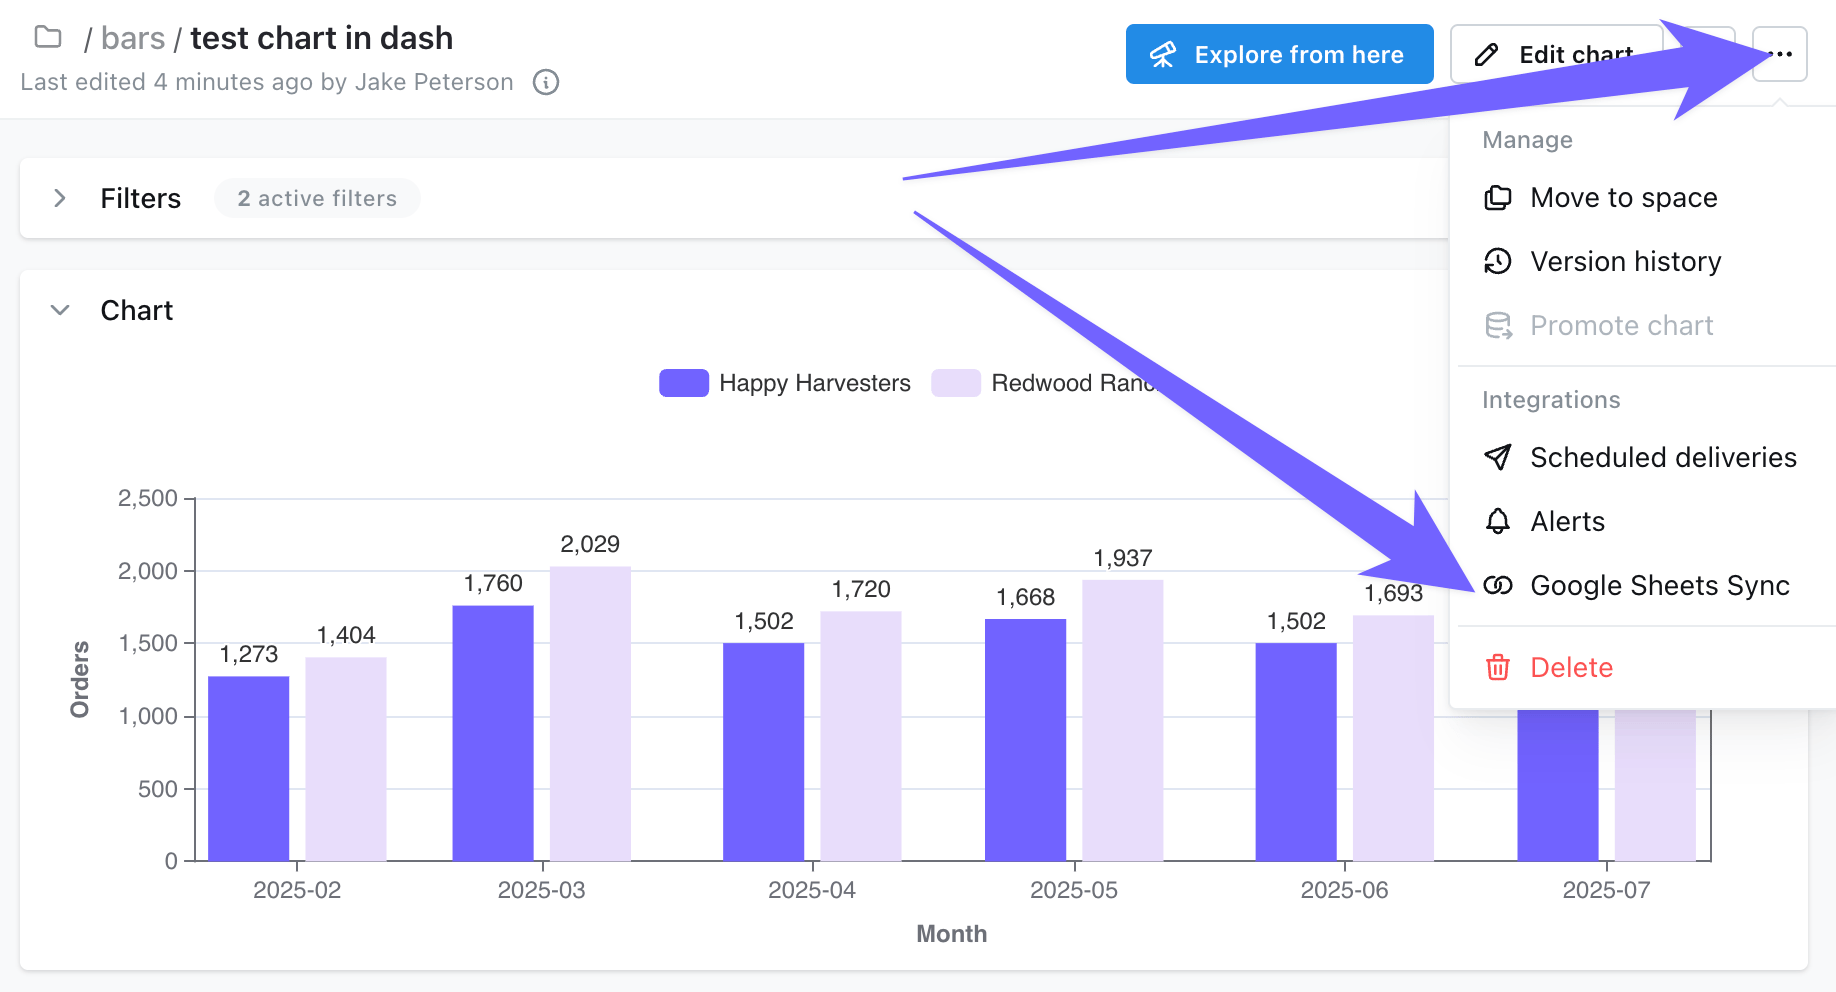
Create new Sync. Clicking Create new Sync takes you to the configuration screen to setup a new Google Sheets Sync.
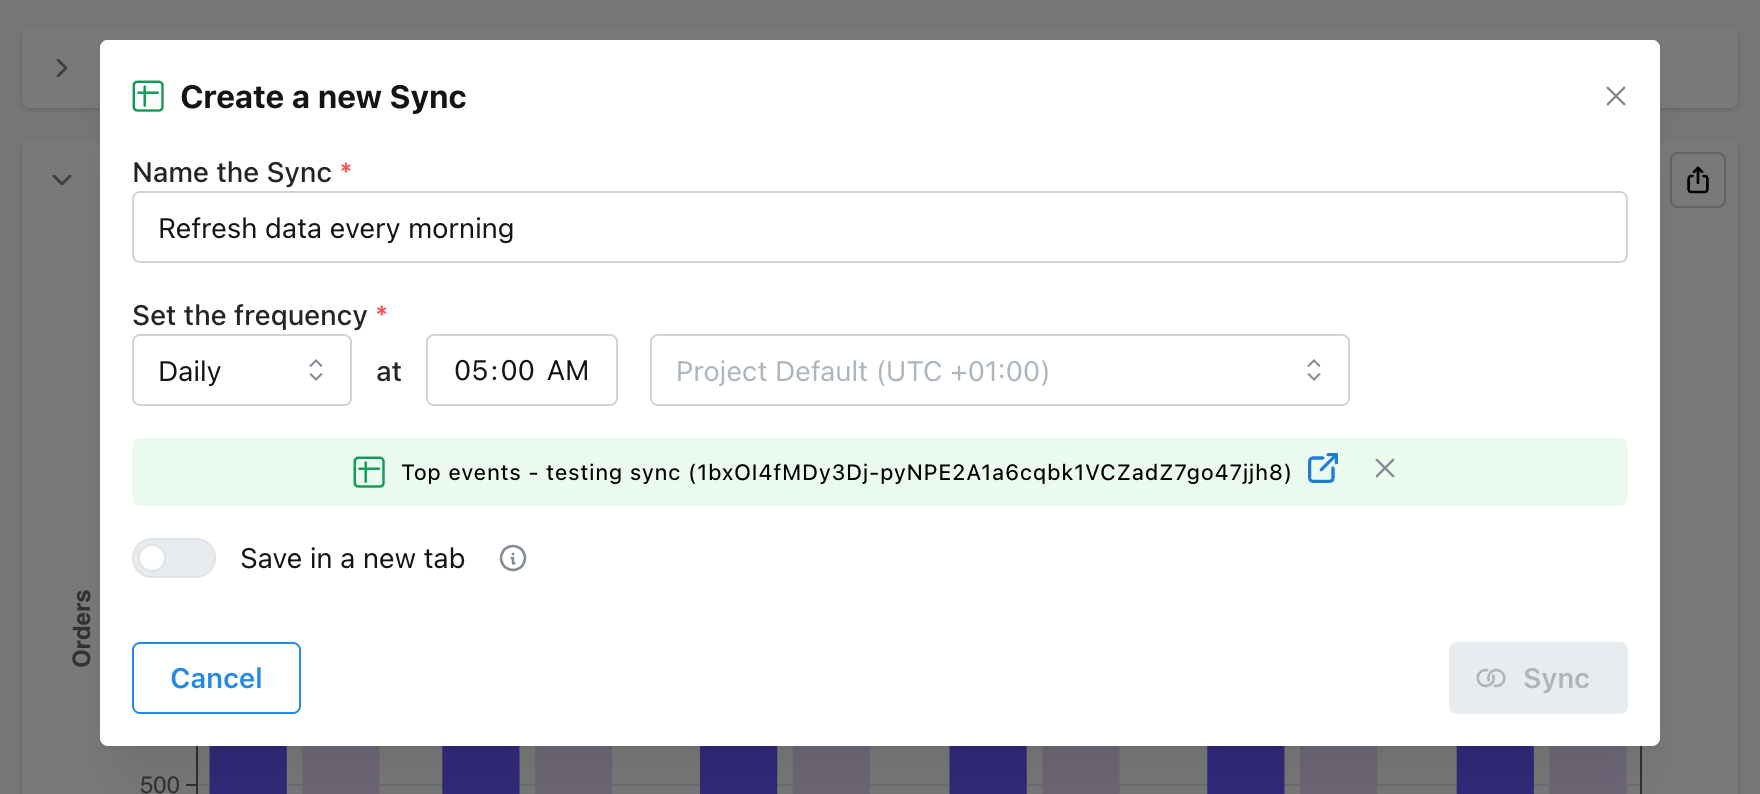
By default, data will be synced to the first tab in your Google Sheet and it will overwrite all the content. If you want to select a specific tab, use the Save in new tab option.
Sync options
- Name: this is the name of your Sync in Lightdash
- Frequency: this is how often your Google Sheet will be synced. You can make this hourly, daily, weekly, monthly, or custom - each frequency has its own options. For example, with a monthly schedule, you set the day of the month and the time that you want your Sync to be happen. The custom frequency lets you write out your own custom Cron expression if you need something more specific than our standard options. All times for the scheduler are in UTC.
- Select Google Sheet: Use the file picker to select the Google Sheet that you’d like to sync your chart results to. Note: You need to sync to an existing Google Sheet, so ensure you have created it before you can select it here.
- Save in new tab: when enabled, it lets you set a tab name that will be used to store your sync data. The tab will be created if it doesn’t exist yet in the sheet. This will avoid overwriting the first tab of the sheet.
Sync.
Overview of your Syncs
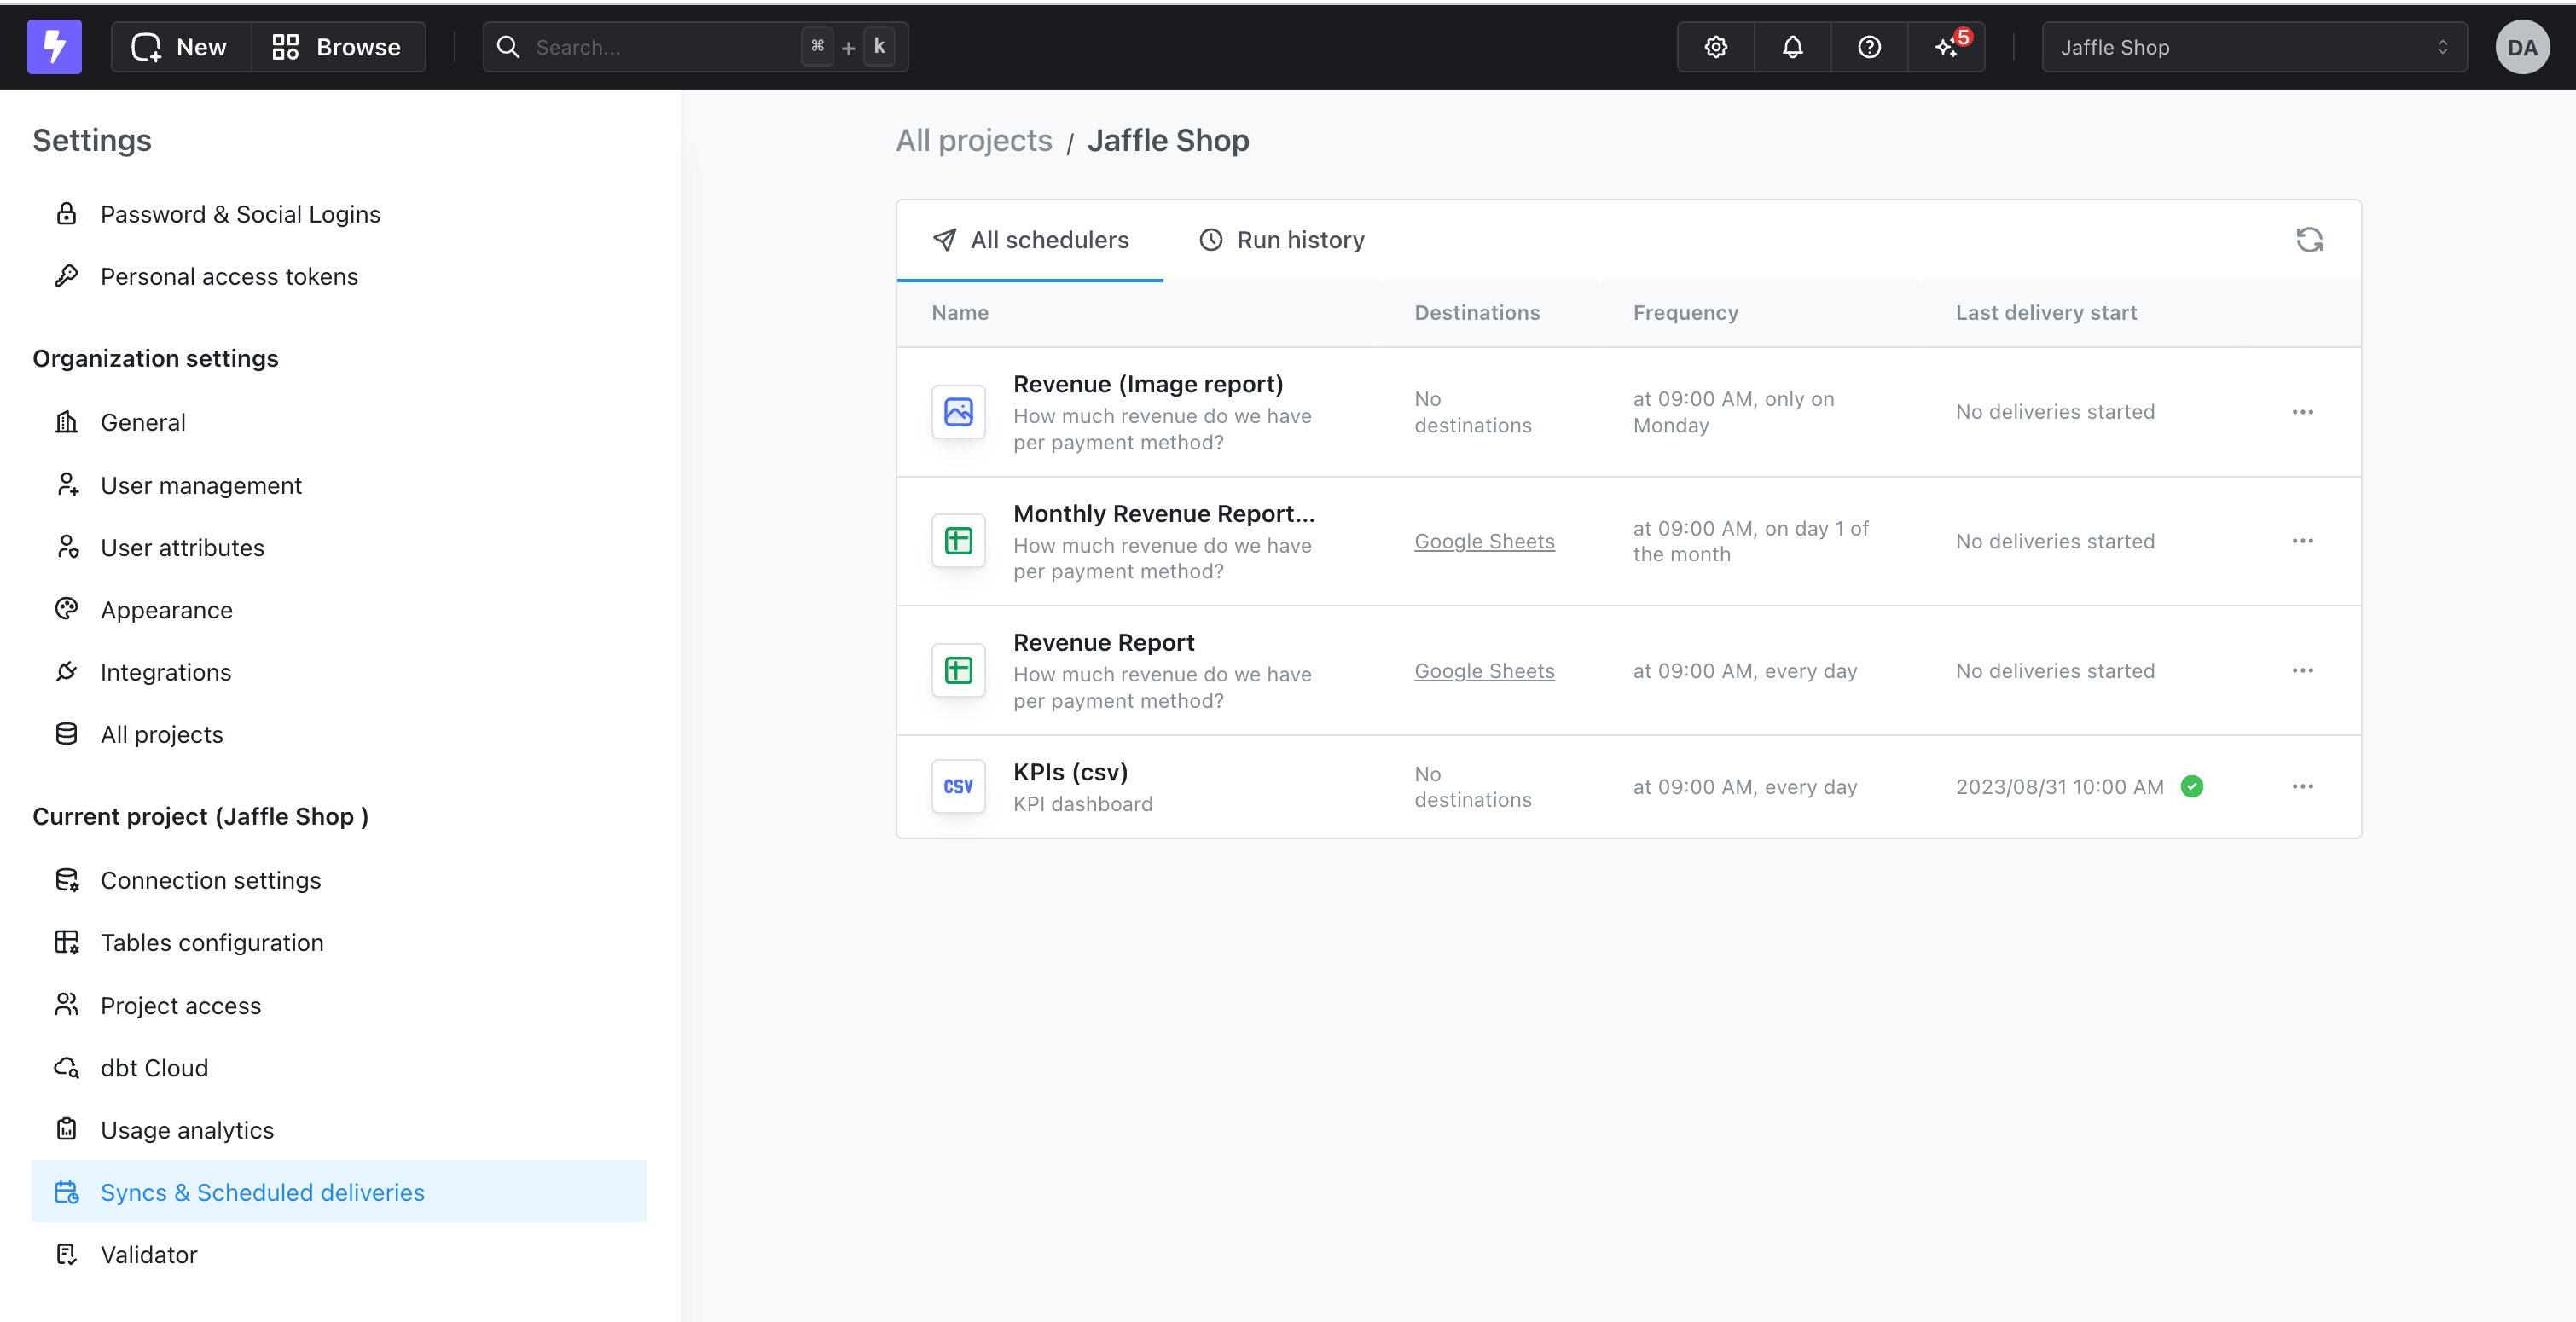
Users who have an admin role in your project can access an overview of your Syncs in the Project Settings. In theSyncs & Scheduled deliveries overview page, you can see a list of all of your Syncs (along with your Scheduled Deliveries), their most recent delivery status, and a history of all of the previous deliveries in your project.
To access the overview page, just head to your Project Settings, then to the Syncs & Scheduled deliveries tab.

Export a dashboard to Google Sheets
Syncs keep a single chart up to date on a schedule. If you instead want a one-off copy of a whole dashboard — for example a data backup to share alongside a report — you can export the dashboard straight to a new Google Sheet. Open the dashboard, click the three-dot menu in the top-right corner, chooseExport dashboard,
then pick Google Sheets as the export format.
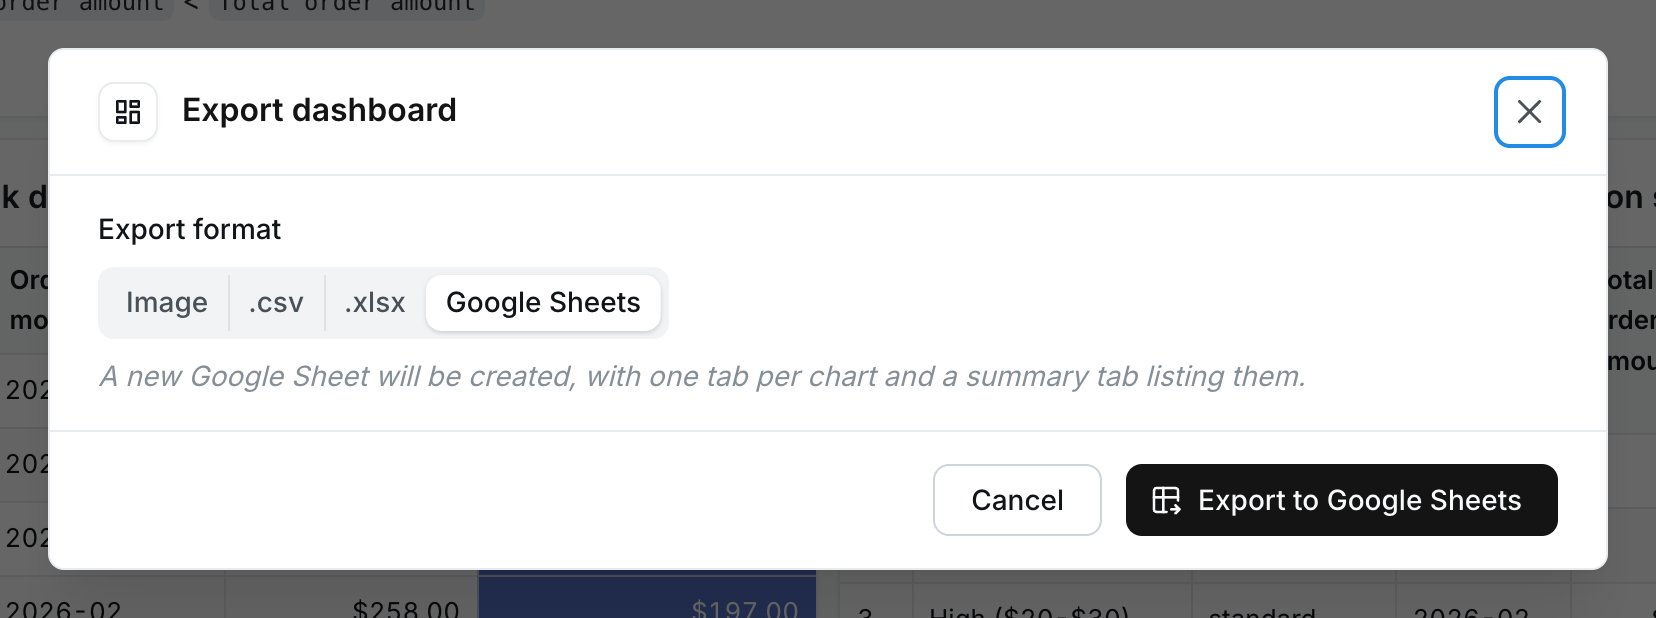
Every export creates a new Google Sheet in your Google Drive. This is not a sync — running
the export again never overwrites a sheet you already have, so each export stays a separate
snapshot.
What you get
The new sheet contains:Export summaryas the first tab: the dashboard name and a link back to it, the time the export ran, and a row for every output listing its tab, the chart it came from, its status, its row count, and a link straight to that tab.- One tab per output, in dashboard order, for each chart and SQL chart tile.
Failed in the summary. This means a chart that breaks doesn’t silently disappear from the
sheet — the rest of the dashboard still exports.
Before you start
- You need editor access or above on the project, the same as for Syncs.
- Your Google account must be connected to Lightdash. If it isn’t, Lightdash will ask you to connect it the first time you export.
- The export uses your dashboard’s current filters, parameters, and tab selection.
Large dashboards are bounded so a single export can’t exceed Google’s per-spreadsheet cell
limit. Any tab trimmed to fit is marked
Truncated in the summary tab with the number of rows
that were written. See Export limits for the details.Google Sheets add-on
The Google Sheets add-on is currently in alpha.
What you can do with the add-on
- Browse your semantic layer: pick a project, then an explore, and see all of its dimensions and metrics grouped by table.
- Build a query interactively: choose the dimensions and metrics you want, reorder columns, and load the results into the currently selected cell in the sheet.
- Pivot your results: pivot dimensions into columns directly from the sidebar so the loaded range is shaped the way you want it in the sheet.
- Filter with the model’s rules: filters defined in your dbt models are respected —
required_filtersare prefilled and can’t be removed (values are still editable), whiledefault_filtersare prefilled but can be adjusted or removed. - Add ad-hoc filters: layer additional dimension and metric filters on top of the model’s defaults from within the sidebar.
- Refresh a saved report: each spreadsheet remembers its last query, so you can re-run it from the Lightdash menu with Refresh last report and rewrite the same range with fresh data.
- Sign in with your Lightdash account: authentication uses OAuth against your Lightdash instance, so results reflect what the signed-in user is allowed to see.